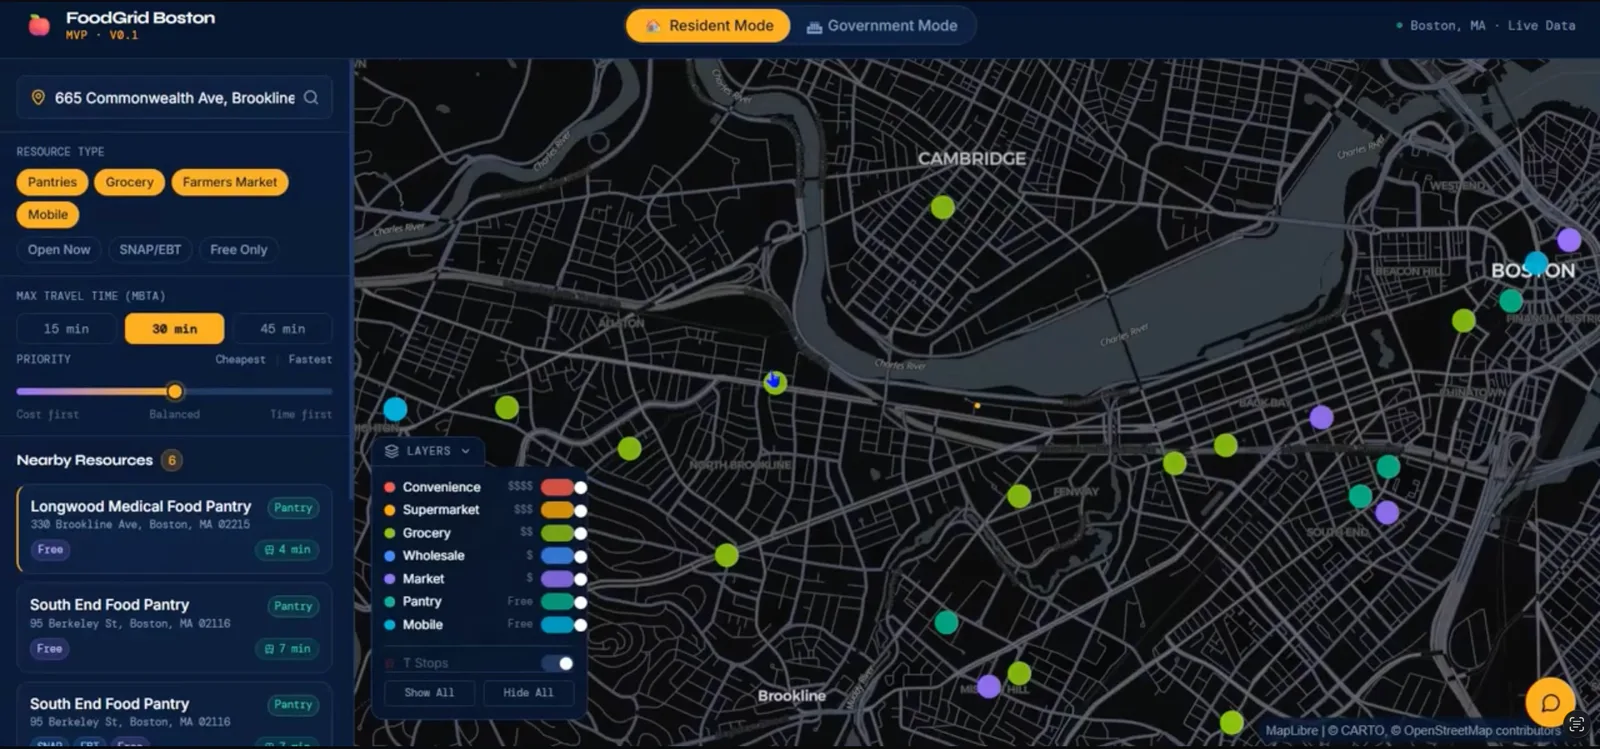
Problem
Food access is unevenly distributed across a city, but residents and policymakers lack a shared, interactive way to see and act on the gaps.
Solution
A civic app with two modes. Residents find nearby resources and chat with a multilingual assistant; government users simulate adding resources and watch the equity score change in real time across Boston census tracts.
What I Built
FoodGrid maps food access across Boston census tracts and splits into two modes for its two audiences. In resident mode, people find nearby food resources and ask questions through a multilingual LLM assistant, so the tool works for more of the city than English alone would reach. In government mode, planners simulate adding a resource to a tract and watch a live equity score update across the map, which turns a static map into something they can actually test decisions against. Both modes sit on an interactive geospatial visualization that makes the gaps legible at a glance.
Technical Details
- React and TypeScript
- Django REST and Node/Express
- MongoDB Atlas
- Deck.gl and MapLibre
- Llama 3.1 for the multilingual assistant
What I Learned
- A simulation mode turns a map into a decision tool for policymakers.
- Multilingual chat made the resident side usable for more of the city.
- Won Best Overall and Best in the EcoHack track at MLH CivicHacks.